













An HRV by age chart shows how heart rate variability falls as you get older. In the largest dataset, from 8 million Fitbit users, median early-morning RMSSD fell from 56 ms in women and 66 ms in men at age 20 to about 28 ms at age 60. The numbers depend heavily on how HRV was measured, so only compare like with like.
Below: three reference charts by age and sex, how each was measured, and why your own baseline matters more than any of them.
Key takeaways
- Every large study agrees that HRV falls with age, fastest between your twenties and your fifties.
- Early-morning wearable data puts median RMSSD at about 45 to 49 ms at age 30, 37 to 38 ms at 40 and 31 ms at 50.
- Men and women have similar RMSSD from middle age. Differences show up mainly in younger adults and in SDNN-type measures.
- Overnight, 5-minute and 24-hour readings are different measurements. A number from one method cannot be read against a chart built with another.
- Half of healthy people sit outside the middle band of any chart. Your trend against your own baseline tells you far more.
How to read an HRV chart
For the basics, see our guide to what a good HRV is. Before using any chart, check three things:
- The metric. Most charts and most wearables use RMSSD, which tracks fast beat-to-beat changes driven by the rest and recover side of the nervous system. SDNN (called SDRR in some wearable studies) measures overall variability and runs higher.
- The method. A 5-minute reading lying down, an hour of data near the end of the night and a 24-hour recording each give different numbers for the same person.
- The statistic. HRV values are skewed, with a long tail of high readers, so a mean usually sits above a median.
A 2025 systematic review of HRV reference values looked at 58 studies and concluded that there are still no generally accepted normal values, because recording length, time of day, equipment and the people studied all vary. Treat every table below as a guide, not a pass mark.
HRV by age chart: early-morning wearable data
Researchers at Fitbit analysed more than 8 million users and published the results in The Lancet Digital Health, with full benchmark tables in the preprint version of the study.
Method: optical sensors on the wrist, RMSSD calculated over 5-minute windows, then the median of those windows between 6am and 7am. That hour sits close to the daily high point of HRV, and the authors note that usable data was much easier to collect while people were asleep and still. Each age is a one-year band.
| Age | Women: median RMSSD | Women: middle half | Men: median RMSSD | Men: middle half |
|---|---|---|---|---|
| 20 | 56 ms | 37 to 85 ms | 66 ms | 45 to 96 ms |
| 25 | 48 ms | 32 to 73 ms | 54 ms | 35 to 79 ms |
| 30 | 45 ms | 31 to 67 ms | 49 ms | 34 to 71 ms |
| 35 | 41 ms | 29 to 60 ms | 43 ms | 31 to 62 ms |
| 40 | 37 ms | 26 to 52 ms | 38 ms | 27 to 54 ms |
| 45 | 33 ms | 24 to 46 ms | 34 ms | 25 to 48 ms |
| 50 | 31 ms | 22 to 42 ms | 31 ms | 23 to 42 ms |
| 55 | 29 ms | 22 to 40 ms | 29 ms | 21 to 39 ms |
| 60 | 28 ms | 21 to 38 ms | 27 ms | 20 to 37 ms |
The middle half runs from the 25th to the 75th percentile. The preprint gives no RMSSD tables beyond age 60.
Average sleeping HRV by age
No large study has published whole-night HRV by age. The 6am to 7am figures above are the closest: an hour near the end of the night, when many people are still asleep and the sensor gets its cleanest data. The same study also reported 6pm to 7pm, and the gap is clear. At age 40, median RMSSD was 37 ms for women and 38 ms for men in the morning, but 29 ms and 26 ms in the evening. The authors call the daily swing substantial and advise reading HRV at the same time of day.
HRV men vs women: what the data shows
For RMSSD, the difference is small and depends on age. The Fitbit study found no significant difference between men and women for RMSSD. At 20, men had a higher median (66 ms against 56 ms), but by 40 the medians were within 1 ms and from 50 they matched.
SDNN-type measures, which capture slower swings in heart rate, are different: men sit higher at every age. In the same data, median morning SDRR at age 40 was 56 ms for women and 65 ms for men. In 24-hour recordings, Umetani and colleagues found HRV was lower in women than men under 30, the gap narrowed after 30 and disappeared after 50.
So what is the average HRV for women? On early-morning wearable data, median RMSSD is about 45 ms at 30, 37 ms at 40, 31 ms at 50 and 28 ms at 60.
Normal HRV by age from 5-minute resting tests
Labs usually measure HRV with a short, controlled test. The best large example by age and sex is the KORA S4 analysis by Voss and colleagues, covering 1,906 healthy adults aged 25 to 74 in southern Germany.
Method: 5-minute electrocardiogram (chest electrode) recordings, lying down after 5 to 10 minutes of rest. People with hypertension, thyroid disease, cancer, a past heart attack, angina or stroke, and anyone taking medicines that affect heart rate, were excluded. Values are the mean, with the standard deviation (SD) in brackets.
| Age | Women: RMSSD | Men: RMSSD | Women: SDNN | Men: SDNN |
|---|---|---|---|---|
| 25 to 34 | 42.9 ms (SD 22.8) | 39.7 ms (SD 19.9) | 48.7 ms (SD 19.0) | 50.0 ms (SD 20.9) |
| 35 to 44 | 35.4 ms (SD 18.5) | 32.0 ms (SD 16.5) | 45.4 ms (SD 20.5) | 44.6 ms (SD 16.8) |
| 45 to 54 | 26.3 ms (SD 13.6) | 23.0 ms (SD 10.9) | 36.9 ms (SD 13.8) | 36.8 ms (SD 14.6) |
| 55 to 64 | 21.4 ms (SD 11.9) | 19.9 ms (SD 11.1) | 30.6 ms (SD 12.4) | 32.8 ms (SD 14.7) |
| 65 to 74 | 19.1 ms (SD 11.8) | 19.1 ms (SD 10.7) | 27.8 ms (SD 11.8) | 29.6 ms (SD 13.2) |
The standard deviations are often half the mean, so healthy people spread widely around these averages. The authors found that differences between men and women disappeared in the last two age decades. For a single pooled figure, a systematic review by Nunan and colleagues reported an average short-term RMSSD of 42 ms in healthy adults, with study averages from 19 to 75 ms.
HRV by age over 24 hours
The oldest widely cited age chart comes from Umetani and colleagues, who recorded 260 healthy people aged 10 to 99 for 24 hours with a portable heart monitor. Values are the mean with the SD in brackets, men and women combined. Groups were small, 20 to 65 people per decade, so read the older rows with caution.
| Age | 24-hour RMSSD | 24-hour SDNN |
|---|---|---|
| 10 to 19 | 53 ms (SD 17) | 176 ms (SD 38) |
| 20 to 29 | 43 ms (SD 19) | 153 ms (SD 44) |
| 30 to 39 | 35 ms (SD 11) | 143 ms (SD 32) |
| 40 to 49 | 31 ms (SD 11) | 132 ms (SD 30) |
| 50 to 59 | 25 ms (SD 9) | 121 ms (SD 27) |
| 60 to 69 | 22 ms (SD 6) | 121 ms (SD 32) |
| 70 to 79 | 24 ms (SD 7) | 124 ms (SD 22) |
| 80 to 99 | 21 ms (SD 6) | 106 ms (SD 23) |
RMSSD fell to 47% of its teenage level by the 50s, then levelled off. The paper's 95% limits for RMSSD run from roughly 21 to 87 ms at age 20, 15 to 63 ms at 40 and 11 to 45 ms at 60. That is how wide normal is.
Why numbers from different methods cannot be compared directly
Here is roughly where a 40 year old sits in each dataset:
| Method | Source | RMSSD around age 40 |
|---|---|---|
| Wrist wearable, 6am to 7am | Fitbit, median | 37 to 38 ms |
| Wrist wearable, 6pm to 7pm | Fitbit, median | 26 to 29 ms |
| 5 minutes lying down | Voss, mean at 35 to 44 | 32 to 35 ms |
| 24-hour recording | Umetani, mean at 40 to 49 | 31 ms |
The same age gives different answers because:
- Time of day. HRV follows a daily rhythm and is usually highest towards the end of the night.
- Recording length. A review of HRV metrics and norms by Shaffer and Ginsberg states that 24-hour and short-term values cannot substitute for each other, even though they use the same formulas.
- Sensor and cleaning. Electrode recordings detect each heartbeat directly. Optical sensors detect each pulse at the skin. The same review notes that just two artefacts in a 5-minute segment can distort RMSSD, so how a system removes noise matters.
How a ring measures HRV overnight
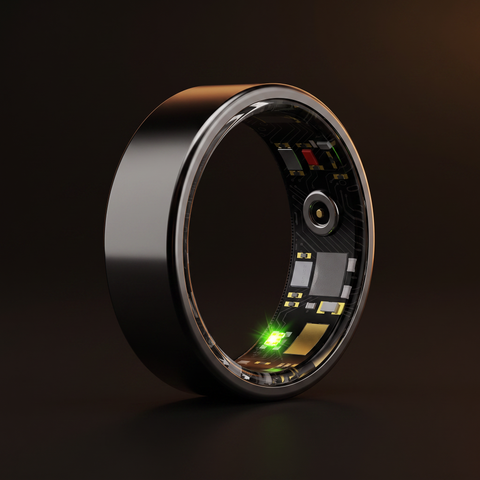
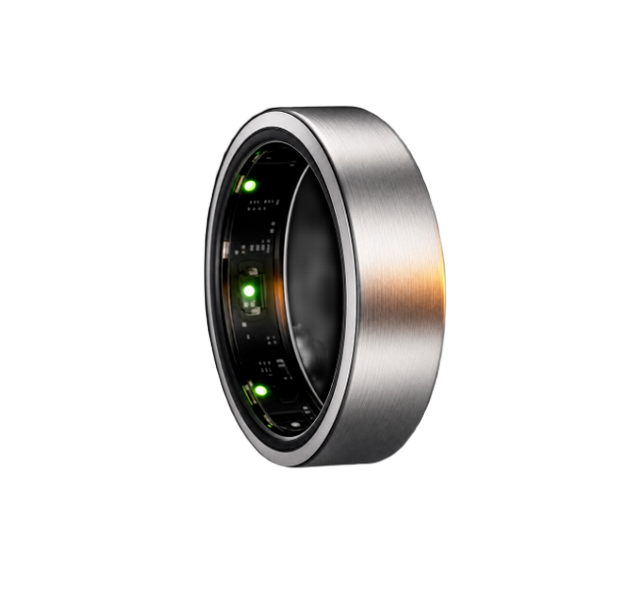
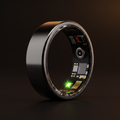
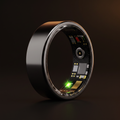
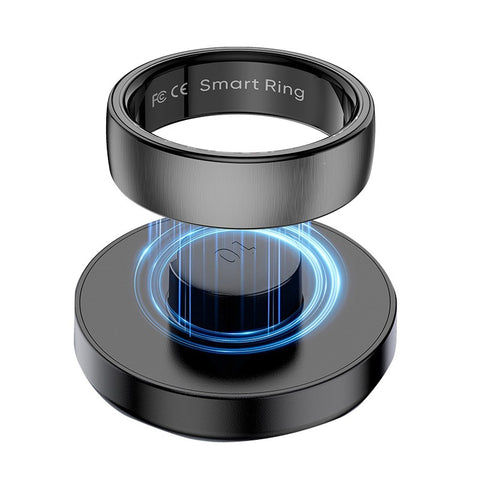
A smart ring shines light into the skin of the finger from optical sensors on the inside of the band and picks up the small change in reflected light each time a pulse of blood arrives. The gap between one pulse and the next stands in for the gap between heartbeats, and HRV is calculated from how much those gaps vary.
The finger is a good place to read a pulse signal because it is well supplied with blood vessels, which is why clip-on pulse oximeters go on a finger. Movement spoils optical readings, so night is the best window: you are still for long stretches. Brands differ in which minutes they use and how they average them, so compare a ring figure with the same ring on other nights.
Why your own baseline matters more than a chart
Half of healthy people fall outside the middle band of any HRV chart, so one number placed on a chart says little about you.
The review of reference values makes the point from the other side: readings from one person, taken the same way, can be reproduced and compared over time, while comparisons between people have no agreed yardstick. Watch a rolling average of several nights against your personal baseline. To see where a specific reading sits, our page answering is my HRV good walks through values from 20 to 100 ms.
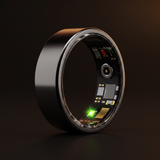
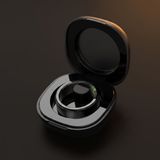
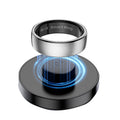
PulseRing Pro reads HRV, resting heart rate, blood oxygen and sleep stages from your finger overnight, while you are still. It builds your personal baseline over roughly two weeks, then gives you one readiness score and one plain sentence each morning: push, maintain or rest. No subscription, and every metric is included for £89.
What moves HRV up and down
Age sets the slow background trend. Day-to-day changes come from:
- Activity. In the Fitbit data, people who took more daily steps over the previous 90 days had higher HRV, in a dose-dependent way.
- Alcohol. In 4,098 Finnish employees, alcohol reduced HRV-based recovery in the first hours of sleep in a dose-dependent way, even after low intake.
- Short sleep, illness, stress and hard training, which tend to pull HRV down for a night or more.
A raised resting heart rate often moves alongside a lower HRV, so read the two together. Our guide to normal resting heart rate covers that side.
Frequently asked questions
What is a normal HRV by age?
On early-morning wearable data from millions of people, median RMSSD is about 56 to 66 ms at 20, 45 to 49 ms at 30, 37 to 38 ms at 40, 31 ms at 50 and 27 to 28 ms at 60. A quarter of healthy people sit below each middle band and a quarter above it, so a wide range is normal at every age.
Do men or women have higher HRV?
It depends on age and the measure. For RMSSD, young men tend to read higher, but from about 40 the medians for men and women are almost identical in large wearable data. SDNN-type measures run higher in men at every age. In 24-hour recordings, sex differences faded after 30 and disappeared after 50.
What is the average sleeping HRV by age?
No large study has published whole-night HRV by age. The closest is Fitbit data from 6am to 7am, near the end of the night and close to the daily peak of HRV: median RMSSD of about 56 to 66 ms at 20, 37 to 38 ms at 40 and 27 to 28 ms at 60. Evening values from the same people were lower.
Why does my HRV not match the chart?
Charts are built with specific methods: an hour of wrist data, a 5-minute test lying down or a 24-hour recording. Your device may use a different window, sensor and averaging, so its numbers will not line up exactly. Natural variation between healthy people is also large. Compare your readings with your own history instead.
Sources
- Systematic review on HRV reference values, Brozat, Böckelmann and Sammito, Journal of Cardiovascular Development and Disease, 2025
- Heart rate variability with photoplethysmography in 8 million individuals: a cross-sectional study, Natarajan et al., The Lancet Digital Health, 2020
- Heart rate variability with photoplethysmography in 8 million individuals: results and scaling relations with age, gender, and time of day, Natarajan et al., bioRxiv preprint, 2019
- Short-term heart rate variability: influence of gender and age in healthy subjects, Voss et al., PLOS ONE, 2015
- A quantitative systematic review of normal values for short-term heart rate variability in healthy adults, Nunan et al., Pacing and Clinical Electrophysiology, 2010
- Twenty-four hour time domain heart rate variability and heart rate: relations to age and gender over nine decades, Umetani et al., Journal of the American College of Cardiology, 1998
- An overview of heart rate variability metrics and norms, Shaffer and Ginsberg, Frontiers in Public Health, 2017
- Acute effect of alcohol intake on cardiovascular autonomic regulation during the first hours of sleep, Pietilä et al., JMIR Mental Health, 2018
This article is for general information and is not medical advice. PulseRing Pro is a wellness device, not a medical device, and does not diagnose or treat any condition. If you are worried about your health, speak to your GP or a qualified clinician.